url <- "https://www.thepowerof10.info/rankings/rankinglist.aspx?event=100&agegroup=ALL&sex=M&year=2012"Athletics rankings
athletics
Using R to gather data from an athletics rankings website.
As a keen athlete I spent many hours on athletics rankings website https://www.thepowerof10.info. For athletics nerds, the site is fantastic and provides all the information you need to keep up to date with the latest results. However, I wondered if it might be possible to explore some alternative ways of presenting the results…
Getting the data
Initially, I had to figure out a way to first gather the data from the power of 10 website. As you can see in the screenshot below, the rankings are already in a table format, so thankfully it wasn’t too difficult to figure something out.
knitr::include_graphics("images/powerof10homepage.PNG")
This was my first time using the rvest package, so I’m sure this code can be improved somewhat… It does, however, seem to do the trick. To start, I identified a url from one of the ranking pages that would serve as a starting point to access the site.
To access other pages it was just a case of supplying new values to the arguments in the url. For example to get the 200m rankings I could just swap the “event=100” for “event=200” in the string. To do this, I wrote a simple function that would generate a vector of strings with the desired events, years and for male or female athletes.
library(tidyverse)
library(zoo)
library(knitr)
library(lubridate)

urlmaker <- function(years, events, gender) {
  url <- "https://www.thepowerof10.info/rankings/rankinglist.aspx?event=100&agegroup=ALL&sex=M&year=2012"
  baseevent <- as.character(str_extract_all(url, "[0-9]+")[[1]][[2]])
  baseyear <- as.character(str_extract_all(url, "[0-9]+")[[1]][[3]])
  newyear <- rep(years, times = length(events))
  list_of_years <- str_replace(url, baseyear, newyear)
  newevent <- rep(events, each = length(years))
  yearandevent <- str_replace(list_of_years, baseevent, newevent)

  sex <- str_c("sex=", gender, sep = "")
  yearandevent <- str_replace(yearandevent, "sex=M", sex)
  return(yearandevent)
}
I then created a string of events and years I wanted to scrape. In this instance I only wanted male athletes, so also set gender to “M”. The result was a vector of urls as character strings that I could use to access the necessary pages.
events <- c("100", "200", "400", "800", "1500", "3000", "5000", "10000")
years <- as.character(seq(from = 2006, to = 2018, by = 1))
gender <- "M"

# create list of urls to use for scraping
urls <- urlmaker(years, events, gender)

print(head(urls, 3))
[1] "https://www.thepowerof10.info/rankings/rankinglist.aspx?event=100&agegroup=ALL&sex=M&year=2006"
[2] "https://www.thepowerof10.info/rankings/rankinglist.aspx?event=100&agegroup=ALL&sex=M&year=2007"
[3] "https://www.thepowerof10.info/rankings/rankinglist.aspx?event=100&agegroup=ALL&sex=M&year=2008"Next, I had to figure out a way to actually get the data. Inspecting the html code on the page helped to identify the labels for the tables that I needed.
knitr::include_graphics("images/po10_window.png")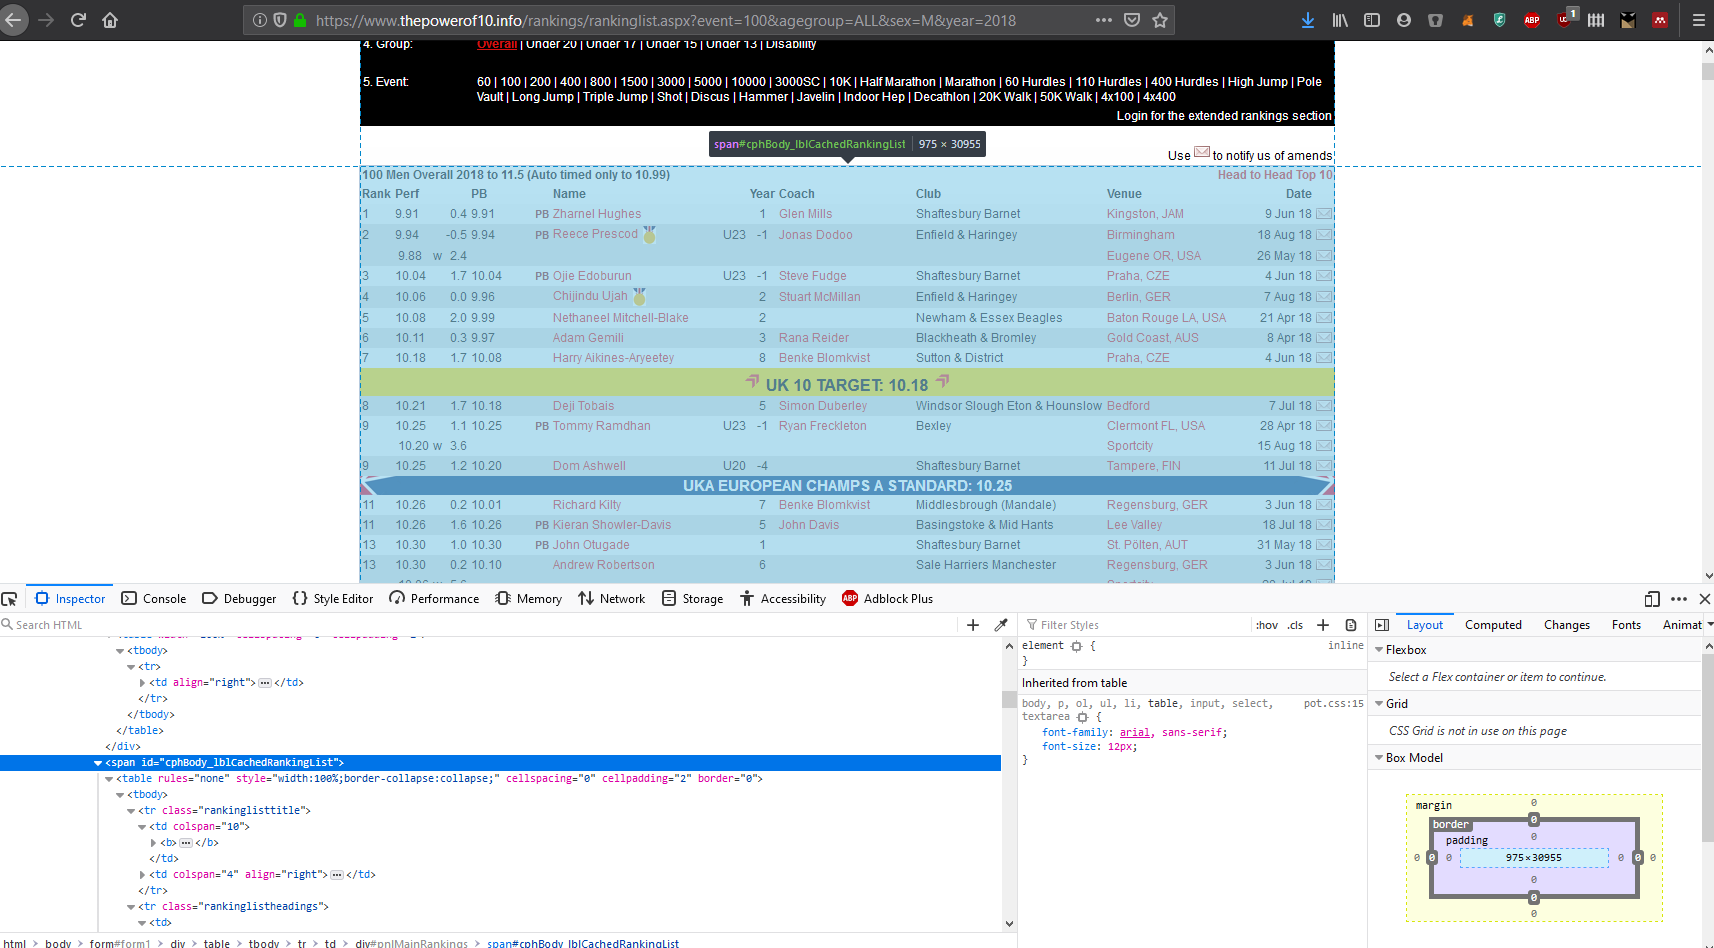
Once I knew how the different elements on the page were identified, it was as easy as copying and pasting the table id into html_nodes() and converting to a table with html_table(). After that it was just the usual wrangling you’d expect with a messy data frame.
library(rvest)

readtable <- function(url) {
  main <- read_html(url)
  rankings <- main %>%
    html_nodes(xpath = '//*[@id="cphBody_lblCachedRankingList"]/table') %>%
    html_table() %>%
    data.frame() %>%
    select(1:13) %>%
    set_names(c("rank",
                "perf",
                "windy",
                "windspeed",
                "PB",
                "newpb",
                "name",
                "agegroup",
                "month_year",
                "coach",
                "club",
                "venue",
                "date")) %>%
    mutate(
      year = as.numeric(str_extract_all(url, "[0-9]+")[[1]][[3]]),
      event = as.numeric(str_extract_all(url, "[0-9]+")[[1]][[2]])
    ) %>%
    mutate_at(vars(name), list(~ replace(., . == "", NA))) %>%
    mutate(name = na.locf(name))
}
Now I simply had to pass the url to the function, and we’ll have the table from the webpage stored as a dataframe.
ranks <- readtable(url)

ranks %>%
  slice(4:6) %>%
  select(rank, perf, name, year, club, venue) %>%
kable()| rank | perf | name | year | club | venue |
|---|---|---|---|---|---|
| 1 | 10.02 | Dwain Chambers | 2012 | Belgrave | Olympic Park |
| 2 | 10.05 | Adam Gemili | 2012 | Blackheath & Bromley | Barcelona, ESP |
| 3 | 10.13 | James Dasaolu | 2012 | Croydon | Olympic Park |
If I wanted to scrape multiple urls at once I would use map_df. Here I can pass my vector of urls and map_df will perform the scraping function readtable on each element in the vector and append the result together (this can take a while to complete so I’ll just use the first 3 urls from our vector of 104 urls).
urls_short <- urls[1:3]

male_rankings <- urls_short %>%
  map_df(readtable)
Now we can view the top ranked athlete for each year.
male_rankings %>%
  filter(rank == "1") %>%
  select(year, rank, perf, name, club, venue) %>%
kable()| year | rank | perf | name | club | venue |
|---|---|---|---|---|---|
| 2006 | 1 | 10.07 | Dwain Chambers | Belgrave | Gateshead |
| 2007 | 1 | 10.06 | Marlon Devonish | Coventry | Lausanne, SUI |
| 2008 | 1 | 10.00 | Dwain Chambers | Belgrave | Birmingham |
Individual athletes
The PO10 also provides detailed performance history for individual athletes. I wanted to be able to have access to this data as well, however I wanted to avoid downloading every individual athletes data to disk as I imagine that may have taken a while…
Instead the solution I came up with was a function get each individual athlete’s unique identifier number. With this number I could get each athletes individual rankings when required using an “on the fly” scrape, as a single athletes page is not very much data at all.
The screenshot below shows how the code that I needed to extract
knitr::include_graphics("images/po10id.png")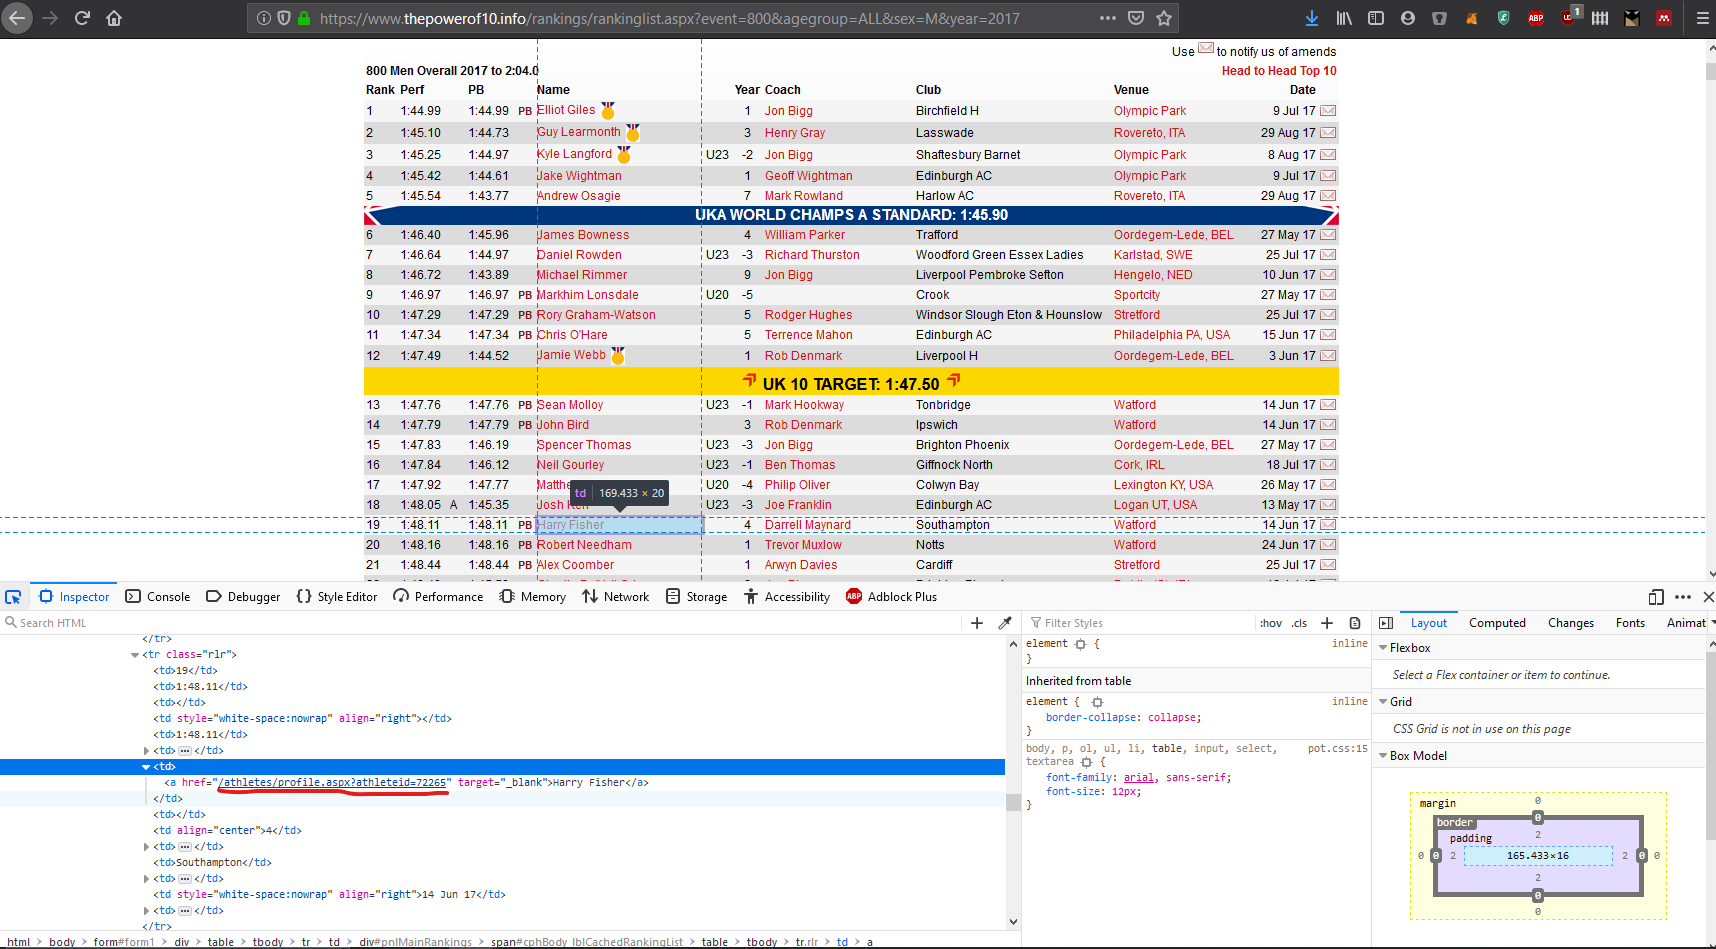
The function below collects the athltes name, unique url, year and event.
athleteurl <- function(url) {
  main <- read_html(url)
  athleteinfo <- tibble(
    name = html_text(html_nodes(main, "td:nth-child(7) a"), "href"),
    athleteurl = html_attr(html_nodes(main, "td:nth-child(7) a"), "href"),
    year = as.numeric(str_extract_all(url, "[0-9]+")[[1]][[3]]),
    event = as.numeric(str_extract_all(url, "[0-9]+")[[1]][[2]])
  ) %>%
    filter(name != "")
}

ids <- athleteurl(url)

head(ids)
# A tibble: 6 × 4
name athleteurl year event
<chr> <chr> <dbl> <dbl>
1 Dwain Chambers /athletes/profile.aspx?athleteid=31816 2012 100
2 Adam Gemili /athletes/profile.aspx?athleteid=208735 2012 100
3 James Dasaolu /athletes/profile.aspx?athleteid=22721 2012 100
4 Harry Aikines-Aryeetey /athletes/profile.aspx?athleteid=19988 2012 100
5 Mark Lewis-Francis /athletes/profile.aspx?athleteid=21139 2012 100
6 James Alaka /athletes/profile.aspx?athleteid=22255 2012 100In another function I join these two tables together so I had one data frame that had all the results and rankings as well as each athletes individual id that I could use to get their individual data. I also appended the full address to each individual athletes id.
finaljoin <- function(ranks, ids, gender) {
  yeartimes <- ranks %>%
    group_by(year, event) %>%
    filter(str_detect(rank, "[:alpha:]")) %>%
    select(year, rank) %>%
    filter(str_detect(rank, "^UK")) %>%
    separate(rank, c("topn", "timing"), ": ") %>%
    spread(key = topn, value = timing) %>%
    ungroup()
  cleanrankings <- ranks %>%
    filter(!str_detect(rank, "[:alpha:]")) %>%
    inner_join(., ids, by = c("name", "year", "event")) %>%
    mutate(athleteurl = paste("https://www.thepowerof10.info", athleteurl, sep = ""))

  cleanrankings <- left_join(cleanrankings, yeartimes, by = c("event", "year")) %>%
    janitor::clean_names() %>%
    mutate(gender = gender)
}
This left me with a complete dataframe I could work with, with the options of getting individual athletes data as needed,
clean_ranks <- finaljoin(ranks = ranks, ids = ids, gender = "M")Adding missing grouping variables: `event`clean_ranks %>%
head() %>%
select(rank, perf, name, year, club, venue, athleteurl) %>%
kable()| rank | perf | name | year | club | venue | athleteurl |
|---|---|---|---|---|---|---|
| 1 | 10.02 | Dwain Chambers | 2012 | Belgrave | Olympic Park | https://www.thepowerof10.info/athletes/profile.aspx?athleteid=31816 |
| 2 | 10.05 | Adam Gemili | 2012 | Blackheath & Bromley | Barcelona, ESP | https://www.thepowerof10.info/athletes/profile.aspx?athleteid=208735 |
| 3 | 10.13 | James Dasaolu | 2012 | Croydon | Olympic Park | https://www.thepowerof10.info/athletes/profile.aspx?athleteid=22721 |
| 4 | 10.20 | Harry Aikines-Aryeetey | 2012 | Sutton & District | Rovereto, ITA | https://www.thepowerof10.info/athletes/profile.aspx?athleteid=19988 |
| 5 | 10.21 | Mark Lewis-Francis | 2012 | Birchfield H | Mesa AZ, USA | https://www.thepowerof10.info/athletes/profile.aspx?athleteid=21139 |
| 6 | 10.22 | James Alaka | 2012 | Blackheath & Bromley | Eugene OR, USA | https://www.thepowerof10.info/athletes/profile.aspx?athleteid=22255 |
The final function I used was to scrape and clean each individuals rankings “on the fly”. The only input is an athletes individual url. The result was another dataframe that contains an individual athletes history of performances.
individual <- function(athlete) {
  history <- athlete %>%
    read_html() %>%
    html_nodes(xpath = '//*[@id = "cphBody_pnlPerformances"]/table') %>%
    html_table(fill = TRUE) %>%
    .[[2]] %>%
    select(-c(X4, X5, X8, X9)) %>%
    set_names(c("event",
                "perf",
                "indoor",
                "position",
                "heat",
                "venue",
                "meeting",
                "date")) %>%
    filter(!str_detect(event, "[:alpha:]")) %>%
    mutate(
      date = dmy(date),
      year = substr(date, 1, 4),
      perf_time = case_when(
        str_detect(perf, ":") == FALSE ~ str_c("00:00:", perf),
        str_length(str_split_fixed(perf, ".", 4)[4]) == 3 ~ str_c(perf, "0"),
        str_length(perf) == 6 | str_length(perf) == 7 ~ str_c("00:0", perf),
        str_length(perf) == 8 | str_length(perf) == 9 ~ str_c("00:", perf),
        TRUE ~ perf
      )
    )
  name <- read_html(athlete)
  name <- html_text(html_nodes(name, css = "h2"), trim = TRUE)
  history <- history %>%
    mutate(name = name)
  return(history)
}
athlete <- "https://www.thepowerof10.info/athletes/profile.aspx?athleteid=31816"
individual(athlete) %>%
head(5) %>%
select(name, event, perf, position, venue, meeting, date) %>%
kable()| name | event | perf | position | venue | meeting | date |
|---|---|---|---|---|---|---|
| Dwain Chambers | 100 | 10.91 | 4 | Sportcity | Müller British Championships inc. Invitation 10000m | 2021-06-25 |
| Dwain Chambers | 60 | 6.73 | 1 | Lee Valley | South of England AA U20 / Senior Championships | 2020-02-01 |
| Dwain Chambers | 60 | 6.74 | 1 | Lee Valley | South of England AA U20 / Senior Championships | 2020-02-01 |
| Dwain Chambers | 60 | 6.76 | 2 | Lee Valley | London U20 / Senior Games | 2020-01-19 |
| Dwain Chambers | 60 | 6.77 | 5 | Lee Valley | Scienhealth Athletics Invitational | 2020-01-05 |
So that’s it! I am currently in the process of creating an interactive dashboard to visualise these results. You can see an early version here:
https://harryfish.shinyapps.io/resultsdashboard/
Lots of work left to do, but any comments or feedback are always welcome. The source code is on my github if you want to try anything out.
Thanks for reading!